GIS DAY IS NOVEMBER 18
By Emily Pierce, PLS, CFedS
When I was in college, geography seemed to be a dying academic field. Nevertheless, it was where I found my true passion for geography, while everyone else was there just to satisfy a required General Ed. requirement. It was, for nearly everyone in my class, something they HAD to do. For me, it felt like home. I realized this was a field I wanted to pursue and learn more about. Fortunately, that class, and that instructor, inspired me to research professions in geography, and soon after, I found surveying – a truly interesting way to use maps to create something of lasting value.
Little did I know that dusty old geography would become the one of the most interesting (and explosively-growing) fields in science. Today Geographic Information Systems (GIS) is shaking up the world of geography – and statistics, data analysis, spatial data, modeling, geostatistics, cartography, data integration, GPS – and on and on.
1854 – The Beginning

Dr. Snow’s waterworks map of 1846 from the UCLA Epidemiology John Snow Site
GIS first appeared as a map created by Dr. John Snow in 1854. He plotted all of the cholera outbreak locations in London, along with roads, property boundaries and water lines. His map revealed that cholera outbreaks were clustered around a water pump, challenging the existing notion that cholera was spread through the air. Along with creating one of the first uses of Geographic Information, Dr. Snow also is credited with starting the field of Epidemiology.
Soon, plotting data on maps became more common – besides public health applications, insurance companies used them to plot firesand thereby compute insurance rates, Governmental tax offices plotted property lands to evaluate tax rates, and natural resource departments plotted wetland areas, flood zones, and water bodies to help protect our waterways and natural habitats. More and more types of data were plotted on maps, but it was painstaking work.
1960 – Computer Mapping
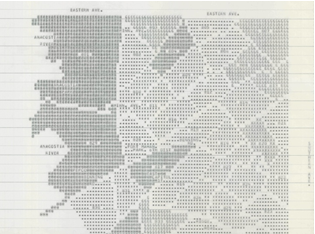
Early Computer Map of the Crime Statistics of Washington,DC
Early Computer Cartography Project, Geography and Map Division, Library of Congress.
Then came computers. Initially, in the 1960s, most maps were still tied to paper because they had to be printed out to be viewed. But as memory increased, maps were finally freed from paper – the maps could be viewed and analyzed on screens.
Enter Roger Tomlinson, a British-trained geographer and geologist who worked for the Government of Canada and for an Ottowa-based aerial survey company. While working on a project to identify the best location for a tree plantation in Kenya, Tomlinson partnered with IBM to find a way to bridge the gap between geographic data and computer services. This initiative was eventually extended to create a national mapping system that created maps of Canada’s commercially-leveraged land used for agriculture, forestry, wildlife and recreation. It was during this project that Tomlinson created the term “Geographic Information Systems” to describe his synthesis of computer mapping with capabilities for overlay, measurement and digitizing.
2020 – GIS Today
On the basis of Tomlinson’s use of geographic location and computing power, a multi-billion dollar industry is now thriving and impacting almost every aspect of modern life. Nearly everyone in the world is now familiar with the Johns-Hopkins Covid-19 map that provides a stunning visual representation of real-time and historical data that shows where disease is most active. This map is based on Esri technology that was developed based on techniques that were created by Tomlinson. Jack Dangermond, founder and president of Esri, says that “Roger always makes me realize that GIS must first and foremost be focused on providing information that really matters (maps, reports, etc.) and that improves our sciences, processes and decision-making.”
The Future
The combination of increasingly “open” systems and software that has driven much of the explosive growth of GIS will continue. The visualization of real-time data in 3D, GIS-enabled augmented reality and virtual reality is already being used in many sectors -- creating immersive experiences that will expedite planning and coordination.
GIS will continue to drive adoption of the Internet of Things – more and more physical tools and objects will be connected and essentially duplicated in a digital environment.

RFID tags link to data in GIS - for easy updating in the field.
No matter how good digital reality becomes, its value is gauged by how well and accurately it reflects physical reality. For example, what is the value of a 3-D map that is used to guide workers to an underground gas valve – but the location in the map is wrong? That’s where connected marking makes all the difference.
Fortunately, technology is available that solves that issue. Berntsen has been working on this issue for nearly a decade and had developed a system that tags any type of asset (above or below ground) and ties its specific location to data in GIS. The InfraMarker system works with Esri’s ArcGIS Online to tie physical assets to their records in GIS.
This simple RFID technology ensures accuracy, enabling users to leverage the full power of GIS.
Today is GIS Day

That brings us to GIS Day, which is November 18 – when this amazing technology is celebrated – and shared with future surveyors, programmers, engineers, geographers – just about anyone interested in the science of our world.
Esri has a whole website that’s dedicated to GIS Day – I found this storymap particularly interesting and definitely worth sharing. Also, don’t miss the Library of Congress’s GIS Day on November 18th - Mapping the Pandemic.
Additionally, I personally found these maps worth a view:
Esri Covid Pulse for some scary truth
In the Shadow of a Volcano – Nice to see from a distance!
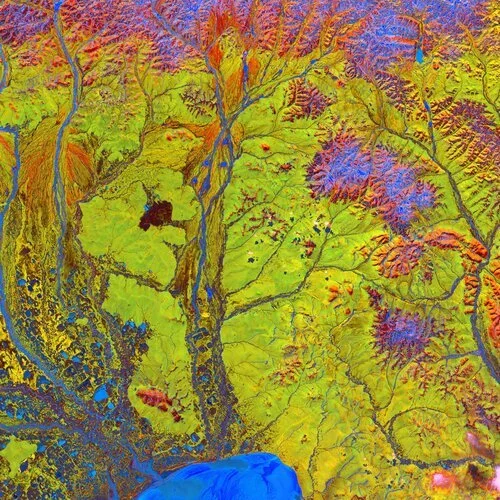
Salmon River’s South Fork – I want to visit this place!