
GIS + RFID = SUE Enhancement
Subsurface Utility Engineering (SUE) that leverages Geographic Information Systems (GIS) and Radio Frequency Identification (RFID) deliver substantial benefits in the management and protection of underground assets.
Subsurface Utility Engineering (SUE) that leverages Geographic Information Systems (GIS) and Radio Frequency Identification (RFID) deliver substantial benefits in the management and protection of underground assets.
Both GIS and RFID are rapidly-growing, powerful technologies that are used across a wide spectrum of industries, from manufacturing to agriculture to SUE.

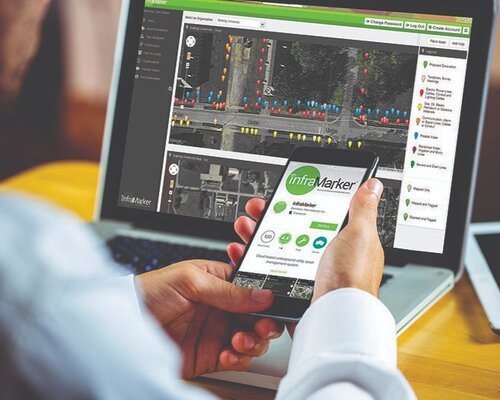
When used together, GIS and RFID deliver accurate, verified information about any type of asset – above or below ground. This is particularly compelling for re-locating buried assets before excavation. It’s essential to know what’s below, and scanning the RFID buried asset tag provides authentication of its data in GIS.
RFID is a simple and durable technology, ideal for pairing with GIS. RFID tags consist of a microchip and antenna. Basic information, such as the asset’s location, identity and owner are written to the tag. When scanned, this data connects to GIS, accessing the correct data and launching maintenance/inspection surveys.
Today, a growing number of agencies and municipalities use Esri’s ArcGIS for Subsurface Utility Engineering. Esri’s popular data collection apps integrate with InfraMarker RFID, making accessible to any organization that uses ArcGIS and Field Maps or Survey123. Recently, Esri announced a June Survey123 update that includes a more seamless integration with InfraMarker RFID.
According to Esri:
“With InfraMarker, a field user can scan a RFID tag and instantly launch the related inspection form in Survey123 … faster and without errors in asset misidentification. You can also use InfraMarker for Survey123 to write information to a new RFID tag and easily associate the unique identifier in your ArcGIS system of record.
The technology is increasingly used in infrastructure asset management thanks to its durability in the field, flexibility to serve as a unique ID on almost any asset, and ability to be read from distance or through mediums such as walls, ground, or concrete.”
SUE and RFID for Infrastructure
This technology is on target for use in all kinds of infrastructure projects that rely on Subsurface Utility Engineering.
The 2022 CGA Technology Report notes that applying emerging mapping/GIS technologies in project design and SUE would reduce potholing and associated expenses involved in locating buried utilities.[1] This report delivers a snapshot of how technology is used specifically to prevent damage during excavation. RFID is included for facility installation and locating, and stated that “a comprehensive national GIS map of buried infrastructure would make the locating process drastically more efficient and accurate, and identify abandoned facilities.”
A recent longitudinal study has demonstrated the long-term feasibility of combining RFID and GIS.
Staking University in Manteno, IL was the site for a perfect test case of using this technology in a residential setting. This campus encompasses more than 20 acres of live and abandoned utilities offering real-world conditions for field testing utility products.
Because RFID markers are passive, they can simply be scanned and connected to GIS for verification – even years later.
In 2015, 174 RFID markers were placed on or near utilities. Utilities marked were:
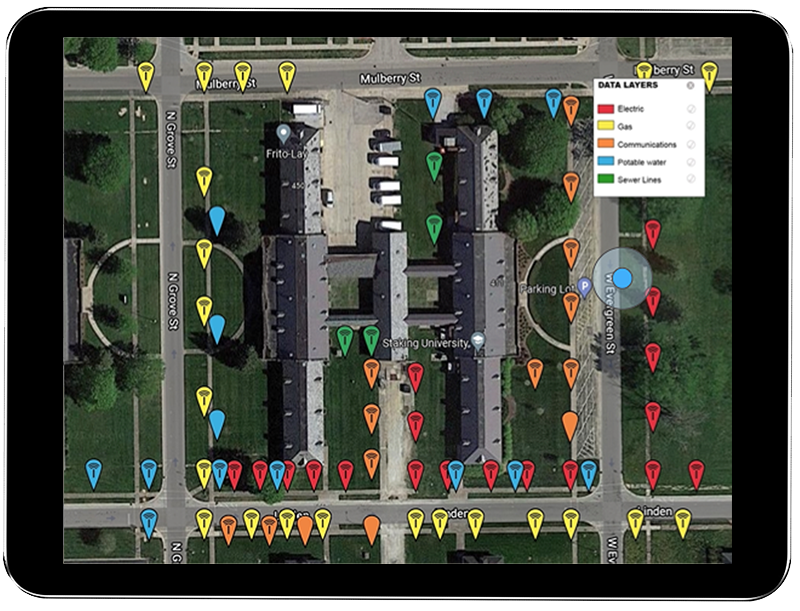
RFID markers of all utilities displayed in GIS
Gas
Electric
Telecom
Potable Water
Sewer
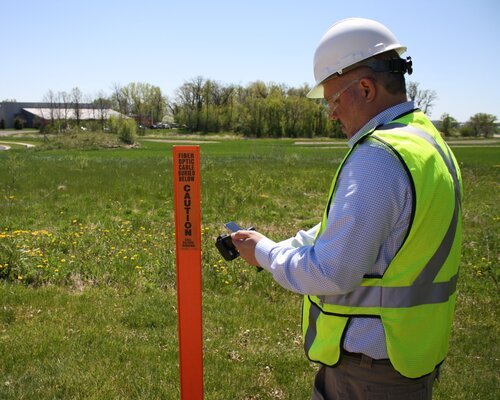
Periodically, the markers were located again by following a simple process – follow the GIS map to the area of a buried marker, scan it through the ground using the RFID reader (which displays and loads the RFID tag), then update that specific record via the InfraMarker mobile app.
In 2022, a thorough review of every marker was conducted and 93% of 174 buried RFID markers were located after seven years in the ground and 97.5% of those produced a successful RFID read.
This study offers a perfect basis to estimate the cost savings for locating and managing a range of utilities.
The average cost per utility strike is $4,000[2].
Assuming one utility strike per year per utility (5 utilities) x 7 (years), the result is 35 utility strikes.
Multiply that by $4,000 and the cost is $140,000.
The cost of the InfraMarker system (174 tags) $3,480 + software (7 years at $2,500/year = 17,500, making a total investment of $20,980.
$140,000 - $20,980 = 119,020
93% of utilities were located, which means $110,688 in utility strikes were prevented.
InfraMarker installation and one year cost is negligible compared to the potential savings resulting from efficient and accurate management of infrastructure assets. Safety is also enhanced due to more accurate asset locating and identification, preventing costly and dangerous utility strikes.
Additional benefits delivered:
One or more utilities can be managed and tracked within one commonly used GIS platform.
Data can be shared within and between organizations or can be controlled to prevent sharing.
InfraMarker’s cloud provides auditable tracking of an organization’s RFID facility activity.
Long-lasting solution - Passive RFID markers continue to connect to software over time, no matter how that software is modified and improved. More and more data can be added to each point, including video, sketches, photos and files – whatever information each organization requires.
Summary
The Common Ground Alliance[3] states that each year, $30 billion in costs are associated with utility strikes. Increased construction spending has consistently proven to correlate with an increase in damage. Anticipated funding from the Infrastructure Investment and Jobs Act is predicted to stress an already inundated damage prevention system[4].
Using RFID/GIS in conjunction with Subsurface Utility Engineering (SUE) amplifies savings and efficiency. The results of a range of DOT studies show that for every dollar spent on SUE, $11.39 in savings are generated[5] by avoiding expensive construction delays and costly utility strikes. Now is the time to create a lasting, accurate picture of subsurface infrastructure that can continue to deliver savings and safety now and in the future.
References:
[1] Technology Advancements & Gaps in Underground Safety Volume 5. © 2022 Common Ground Alliance
[4] DIRT Annual Report for 2021 © 2022 Common Ground Alliance

811 - CALLING IS A MUST, BUT NOT ENOUGH
A week ago today, National 811 Day was commemorated. It’s a national awareness campaign to highlight the need to call 811 before digging – in our yards or at a construction site. Many organizations in charge of utility assets use this day to promote the importance of calling 811 BEFORE digging. For example, The Southern Gas Company did this great “No Diggity” video to help promote awareness.
A Blog by Emily Pierce, PLS, CFedS
There’s a better way.

A week ago today, National 811 Day was commemorated. This means a lot to me because I know first hand how important it is that people make the 811 call before digging. But I also know that there is a lot more to underground safety than more 811 calls. We need better methods for identifying and validating what is underground.
According to the Pipeline and Hazardous Materials Safety Administration (PHMSA), ruptured gas distribution systems have killed an annual average of 10 people and injured an average of 46 more.[i] Excavation damage has almost always been the cause of ruptures that resulted in fatality, an injury requiring in-patient treatment, or damages more than $50,000.
For firms that are excavating every day, the need to “Know what’s below” is essential for safe operations.

The latest DIRT Report (Damage Information Reporting Tool) shows that damages caused by underground utility strikes are increasing for the fifth consecutive year. In 2019, the cost of this damage was estimated at $30 billion. The most common cause listed for these utility strikes was “failure to notify”, meaning no one called 811 before excavation. But other causes, such as excavation issues and locating issues are also leading causes for damage.
The truth is that we don’t really know how much damage is done by excavation errors. In many sectors, there are no legal requirements for reporting utility strikes. Although a growing number of companies are voluntarily reporting, the data provides a very incomplete picture.

The National Society of Professional Surveyors (NSPS) is working to raise the visibility of the need for accurate geospatial data for infrastructure projects that include transportation, energy, communications, water supply, and other systems. NSPS is one of the thirteen members of the Coalition of Geospatial Organizations (COGO) that seek to speak with one voice on geospatial data and policy issues. This group provides input to the Federal Geographic Data Committee that has developed a National Spatial Data Infrastructure Strategic (NSDI) Plan.
These groups were heavily involved in the Infrastructure Bill working its way through our federal legislative process. They are working to ensure that the federal investment in infrastructure improvements include geospatial data components to increase accuracy and precision in our infrastructure investments, like transportation, high-speed internet, power and gas utilities, rails, and clean water.
Trends toward the adoption of new technologies that help create accurate data to help us “Know what’s below” are strengthening. I know that surveyors are embracing new technologies to that help create underground surveys. Along with GIS, LiDAR and GPR, other tools are making the job of underground surveying much easier.
There’s a better way - connected RFID
For example, over the past year, I’ve been working with a number of utilities who are using Connected RFID to track and manage infrastructure assets. RFID is a key technology that enables direct connection between the real world and the geospatial world.
One of the most persistent and thorniest problems of any kind of geospatial data is accuracy. If the data isn’t spatially accurate, then its usefulness is massively reduced. I know I’m preaching to the choir. We surveyors spend our lives creating and correcting geospatial data and understand the importance of accuracy.
A direct connection between an infrastructure asset and its data is of tremendous value, and that’s exactly what InfraMarker RFID does. It’s pretty simple – an RFID tag is affixed to an asset (above or below ground). Each RFID tag has a unique ID that is linked to that asset’s record in the GIS system using software on a mobile device. Once linked, a field technician can scan a tag and automatically load that asset’s specific record for updating. No need for a line of sight with RFID, so this makes InfraMarker perfect for underground utilities.
More and more, gas, water and telecom utilities are adding InfraMarker RFID to enhance the accuracy of their geospatial data and make life easier for field technicians. As a surveyor, think of how much easier our jobs would be if we could actually scan buried markers and have them identify themselves . . . or use the RFID scanner to identify nearby buried utilities.
The advantage of InfraMarker is the accuracy it delivers to help utilities better manage their infrastructure assets. A value-add is that this data could also help prevent excavation strikes, helping everyone “Know what’s below”.
While we know that 811 has some inefficiencies, it is the best first line of defense for damage prevention for a property owner and the utility. Without proper locating subsurface utilities before excavation, the results can be costly.
Interested? Contact me for more info - info@inframarker.com
[i] https://thestoddardfirm.com/premises-liability/construction-accident-injuries/gas-line/

A DAM-AGING STORMWATER REPORT CARD FROM ASCE
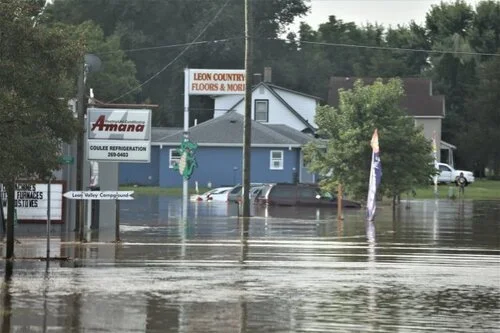
Urban flooding results in more then $9 billion in damages annually, while federal funding to support stormwater maintenance/upgrades averages about $250 million annually. It’s not surprising that stormwater infrastructure is in bad shape and has earned a grade of “D” from the ASCE.
Blog by Tom Hershberger, MS, MBA
Infrastructure is a hot topic now, and it’s long overdue for more than just discussion during National Infrastructure Week.
The American Society of Civil Engineers (ASCE) have been focused on this topic since 1988, producing a regular report card for US infrastructure. At first, there were 12 categories, and with this year’s addition of Stormwater, there are 18 categories.
Urban flooding is problem #1
Urban flooding results in more then $9 billion in damages annually, while federal funding to support stormwater maintenance/upgrades averages about $250 million annually. It’s not surprising that stormwater infrastructure is in bad shape and has earned a grade of “D” from the ASCE.
Stormwater runoff is defined as rain or snowmelt that travels over impervious surfaces or cultivated areas, then is collected and drained into streams, rivers, lakes, bays or oceans. These systems of stormwater conveyance take many forms, from canals, to sewers, detention ponds and constructed wetlands.
In the US, there are approximately:
3.5 million miles of storm sewers
270 million storm drains
2.5 million stormwater treatment assets
Stormwater systems are a mix of publicly-owned (by local, state and the federal government) and privately-owned assets. The EPA is tasked with regulating all of this, but their focus has primarily been on Municipal Separate Storm Sewer Systems, known as MS4s. Because of this, most municipalities have an asset management / maintenance program.
On the other hand, corporate property owners or homeowners associations are not routinely monitored, which leads to deferred maintenance and increases the likelihood of urban flooding and increases the threat of pollution from runoff.
Stormwater conveyance systems have a lifespan of 50-100 years (depending on what materials were used in the original construction, such as reinforced concrete, corrugated metal or PVC). Because most stormwater systems are paid for by local fees or taxes, that often means that maintenance and/or replacement have been postponed, leaving many communities with dangerously outdated stormwater infrastructure.
Even in communities where stormwater systems were constructed more recently (within the past 30 years), it’s likely that they weren’t designed for today’s capacity needs, especially with the growing frequency of high-precipitation events.
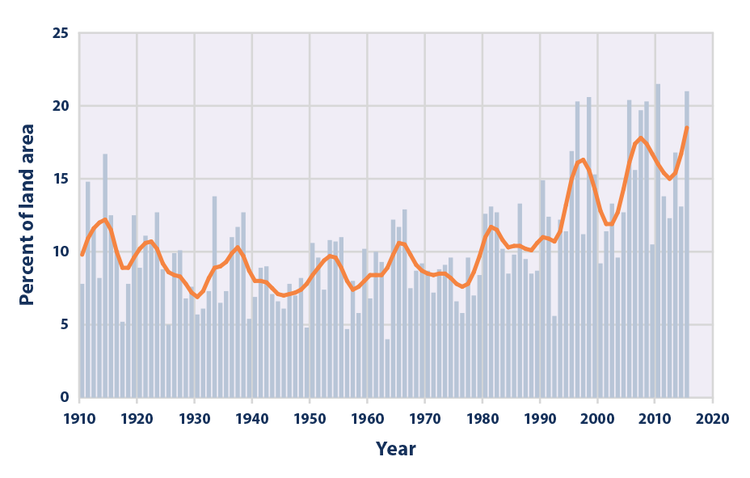
This figure shows the percentage of the land area of the contiguous 48 states where a much greater than normal portion of total annual precipitation has come from extreme single-day precipitation events. The bars represent individual years, while the line is a nine-year weighted average.
Beyond flood mitigation
Stormwater runoff causes lots of problems besides flooding. Every year, an estimated 57 million Americans are sickened by contaminated water in recreational areas. An 2019 analysis of fecal indicator bacteria sampling data from beaches in 29 coastal and Great Lakes states and Puerto Rico, reveals that 386 beaches – nearly one of every eight surveyed – had potentially unsafe levels of pollution on at least 25 percent of the days that sampling took place that year.
Additionally, other types of pollutants flow into our waterways when stormwater is not controlled. For example, the quantity of used oil from a single oil change can pollute up to one million gallons of fresh water. Then there’s all the litter, construction debris, fertilizer, pesticides, road salt, pet waste, etc., that regularly flows into storm sewers. In an up-to-date stormwater system, these pollutants can flow into swayles, rain gardens where they can be held and filtered, instead of flowing directly into a stream, lake or ocean.
It’s vitally important that these systems are brought up-to-date.
Learning to make the most of what we have
Additional money for infrastructure may be on its way, but in the meantime, many municipalities and stormwater management organizations are already executing a plan to be compliant with EPA regulations and plan for the future.
The recommended first step toward improving a stormwater system is to have a comprehensive understanding of the location and condition of all existing stormwater assets. This can be very challenging because oftentimes in municipalities, these records are kept in different departments, housed in different databases or even kept in paper files.
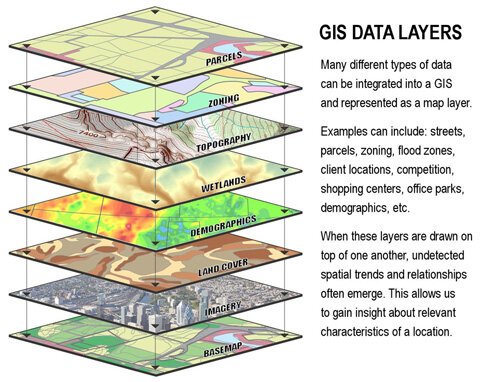
Fortunately, technology can really help with this issue. Geographic Information Systems (GIS) are increasingly being used to manage all types of municipal activities. GIS location-based information is extremely useful in managing stormwater assets spread across a specific geographic area. Today, municipalities are busy creating a digital twin of their existing city, which is a great concept that has real-world benefits but also faces real-world disconnects.

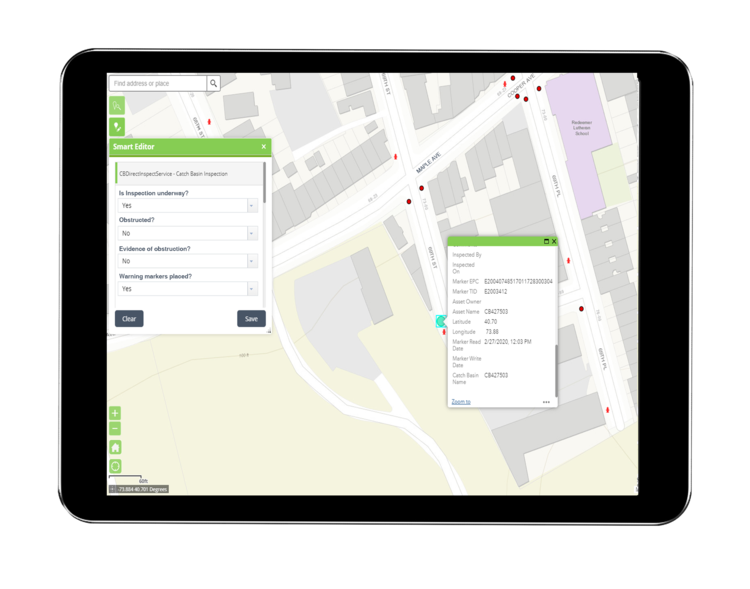
Example images from a geographic information system (GIS) illustrating storm-sewer infrastructure.
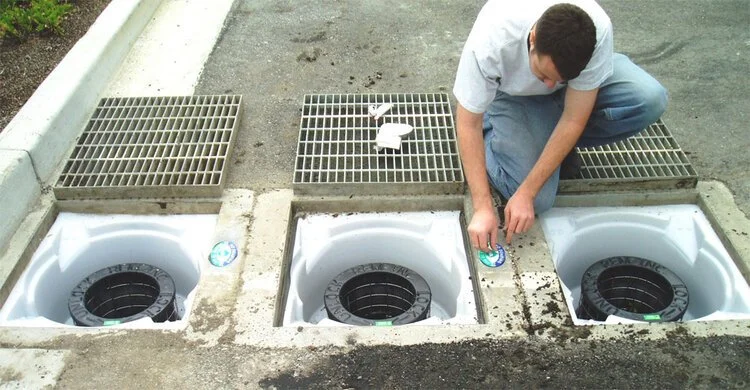
One very common disconnect is that the assets a digital map displays are not what maintenance workers find when they come to a job site. For example, they may be tasked to perform an inspection or maintenance on a catch basin located on a specific intersection. They use the GPS to guide them to that location. Upon arrival, they see not one, but four or even eight catch basins in that area. So they have to invest time in working with the office to identify the right basin, or they just pick one and hope it’s the right one.
Unfortunately, guesswork is what the GIS digital twin was supposed to eliminate.
There’s a simple solution that can permanently resolve that issue, while simplifying field documentation. It involves marking assets with an RFID tag, then connecting those tags to their records in the GIS using a standard mobile device.
InfraMarker connected RFID makes all the difference
When marked with RFID tags, field workers no longer need to guess which asset to work on. They can simply have assets identify themselves with a quick read of the RFID tag. Once they identify the asset they need to work on, the right form will pop up and they can complete the work and move on.
InfraMarker RFID-enabled markers directly connect the physical and digital worlds in a way that delivers fast, accurate and auditable asset management. This approach fits into existing field workflows while leveraging existing GIS/Asset Management platforms. InfraMarker connects specific infrastructure assets to their unique digital records, providing accurate, auditable and actionable data to asset managers, often in real time.
RFID-enabled asset management not only ensures that the digital twin is accurate, it generates an audit trail that meets the EPA regulations for compliance.
This simple solution is now being used for all kinds of infrastructure assets across the country, including municipal stormwater assets.
See a quick video of how InfraMarker Connected RFID works to mark and manage stormwater assets here.
To learn more, contact us!.

INFRAMARKER BY BERNTSEN AWARDED THE ESRI RELEASE READY SPECIALTY DESIGNATION
Berntsen International, the leader in infrastructure marking solutions, announces that it has earned the Esri Release Ready Specialty status. This designation recognizes companies, products and solutions that integrate with Esri technology and are created by partners with expertise in leveraging Esri solutions and software.

MADISON, Wisc. March 24, 2021 - Berntsen International, the leader in infrastructure marking solutions, announces that it has earned the Esri Release Ready Specialty status. This designation recognizes companies, products and solutions that integrate with Esri technology and are created by partners with expertise in leveraging Esri solutions and software.
InfraMarker®, a division of Berntsen International, is the leader in connected RFID-enabled infrastructure asset management. The full InfraMarker line includes rugged RFID-enabled marking products, RFID readers and accessories designed for exceptional field performance, and RFID-connecting software enhancements that leverage Esri’s data collection capab. The InfraMarker approach delivers an essential connected solution for AEC firms, utilities, municipalities and other organizations that design and manage infrastructure assets.
The InfraMarker Web Widget for ArcGIS Web AppBuilder is the latest in InfraMarker’s connected RFID software line. Field personnel using the InfraMarker Web Widget with a web app simply scan an asset RFID tag to confirm the asset ID. The asset’s specific records or inspection forms will automatically launch from the organization’s platform. The process reduces time, cost, and errors while improving compliance controls.

“The InfraMarker Web Widget for ArcGIS Online is a perfect example of the innovation Esri helps make possible,” said Frank Martin, Esri Partner Manager. “This solution enables clients to streamline field asset management while creating accurate, auditable records in ArcGIS Online. InfraMarker provides a simple solution to data collection and compliance issues faced by a range of industries.”
Benefits of the InfraMarker enabled solution:
Simple, Unified Approach – InfraMarker simplifies the asset identification and data collection process in the field. The Web Widget is customizable using ArcGIS Web AppBuilder and easily integrates with ArcGIS Online. Field users can quickly access asset data, maps, files (including images and video) and transmit verified asset data in real-time from the field to the office, enabling up-to-date, accurate asset management.
Scalability and Flexibility – The InfraMarker RFID Solution can mark and manage any asset – above or below ground. RFID tags are incorporated into utility posts, affixed directly on infrastructure assets, or placed underground to identify pipelines, telecom, electric – any asset that needs to be located or tracked.
Improved ROI in the field – InfraMarker eliminates the guesswork involved in identifying specific assets and accessing the correct forms. A simple date/time stamped RFID scan activates an asset’s data record and presents the correct associated record or data collection form on the user’s mobile device. This streamlines operations while enhancing accuracy and providing an audit trail.
“We’re pleased to offer the InfraMarker RFID Web Widget to Esri’s ArcGIS clients,” said Mike Klonsinski, Berntsen International president. “The offering is another advancement in our commitment to enabling a smarter infrastructure world.”
About Berntsen International, Inc. and it’s InfraMarker solution
As an infrastructure marking company founded in 1972, Berntsen has been developing smart marking products for more than a decade. Its patented InfraMarker RFID solution combines the durability and precision of Berntsen marking products with a unique application of RFID technology specifically developed to connect physical markers with digital records. Berntsen has been an Esri Silver Partner for more than 10 years.
About ESRI
Esri, the global market leader in geographic information system (GIS) software, location intelligence, and mapping, helps customers unlock the full potential of data to improve operational and business results. Founded in 1969 in Redlands, California, USA, Esri software is deployed in more than 350,000 organizations globally and in over 200,000 institutions in the Americas, Asia and the Pacific, Europe, Africa, and the Middle East, including Fortune 500 companies, government agencies, nonprofits, and universities. Esri has regional offices, international distributors, and partners providing local support in over 100 countries on six continents. With its pioneering commitment to geospatial information technology, Esri engineers the most innovative solutions for digital transformation, the Internet of Things (IoT), and advanced analytics.
Visit us at esri.com.


GIS DAY IS NOVEMBER 18
Little did I know that dusty old geography would become the one of the most interesting (and explosively-growing) fields in science. Today Geographic Information Systems (GIS) is shaking up the world of geography – and statistics, data analysis, spatial data, modeling, geostatistics, cartography, data integration, GPS – and on and on.
By Emily Pierce, PLS, CFedS
When I was in college, geography seemed to be a dying academic field. Nevertheless, it was where I found my true passion for geography, while everyone else was there just to satisfy a required General Ed. requirement. It was, for nearly everyone in my class, something they HAD to do. For me, it felt like home. I realized this was a field I wanted to pursue and learn more about. Fortunately, that class, and that instructor, inspired me to research professions in geography, and soon after, I found surveying – a truly interesting way to use maps to create something of lasting value.
Little did I know that dusty old geography would become the one of the most interesting (and explosively-growing) fields in science. Today Geographic Information Systems (GIS) is shaking up the world of geography – and statistics, data analysis, spatial data, modeling, geostatistics, cartography, data integration, GPS – and on and on.
1854 – The Beginning

Dr. Snow’s waterworks map of 1846 from the UCLA Epidemiology John Snow Site
GIS first appeared as a map created by Dr. John Snow in 1854. He plotted all of the cholera outbreak locations in London, along with roads, property boundaries and water lines. His map revealed that cholera outbreaks were clustered around a water pump, challenging the existing notion that cholera was spread through the air. Along with creating one of the first uses of Geographic Information, Dr. Snow also is credited with starting the field of Epidemiology.
Soon, plotting data on maps became more common – besides public health applications, insurance companies used them to plot firesand thereby compute insurance rates, Governmental tax offices plotted property lands to evaluate tax rates, and natural resource departments plotted wetland areas, flood zones, and water bodies to help protect our waterways and natural habitats. More and more types of data were plotted on maps, but it was painstaking work.
1960 – Computer Mapping
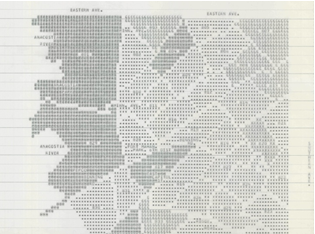
Early Computer Map of the Crime Statistics of Washington,DC
Early Computer Cartography Project, Geography and Map Division, Library of Congress.
Then came computers. Initially, in the 1960s, most maps were still tied to paper because they had to be printed out to be viewed. But as memory increased, maps were finally freed from paper – the maps could be viewed and analyzed on screens.
Enter Roger Tomlinson, a British-trained geographer and geologist who worked for the Government of Canada and for an Ottowa-based aerial survey company. While working on a project to identify the best location for a tree plantation in Kenya, Tomlinson partnered with IBM to find a way to bridge the gap between geographic data and computer services. This initiative was eventually extended to create a national mapping system that created maps of Canada’s commercially-leveraged land used for agriculture, forestry, wildlife and recreation. It was during this project that Tomlinson created the term “Geographic Information Systems” to describe his synthesis of computer mapping with capabilities for overlay, measurement and digitizing.
2020 – GIS Today
On the basis of Tomlinson’s use of geographic location and computing power, a multi-billion dollar industry is now thriving and impacting almost every aspect of modern life. Nearly everyone in the world is now familiar with the Johns-Hopkins Covid-19 map that provides a stunning visual representation of real-time and historical data that shows where disease is most active. This map is based on Esri technology that was developed based on techniques that were created by Tomlinson. Jack Dangermond, founder and president of Esri, says that “Roger always makes me realize that GIS must first and foremost be focused on providing information that really matters (maps, reports, etc.) and that improves our sciences, processes and decision-making.”
The Future
The combination of increasingly “open” systems and software that has driven much of the explosive growth of GIS will continue. The visualization of real-time data in 3D, GIS-enabled augmented reality and virtual reality is already being used in many sectors -- creating immersive experiences that will expedite planning and coordination.
GIS will continue to drive adoption of the Internet of Things – more and more physical tools and objects will be connected and essentially duplicated in a digital environment.

RFID tags link to data in GIS - for easy updating in the field.
No matter how good digital reality becomes, its value is gauged by how well and accurately it reflects physical reality. For example, what is the value of a 3-D map that is used to guide workers to an underground gas valve – but the location in the map is wrong? That’s where connected marking makes all the difference.
Fortunately, technology is available that solves that issue. Berntsen has been working on this issue for nearly a decade and had developed a system that tags any type of asset (above or below ground) and ties its specific location to data in GIS. The InfraMarker system works with Esri’s ArcGIS Online to tie physical assets to their records in GIS.
This simple RFID technology ensures accuracy, enabling users to leverage the full power of GIS.
Today is GIS Day

That brings us to GIS Day, which is November 18 – when this amazing technology is celebrated – and shared with future surveyors, programmers, engineers, geographers – just about anyone interested in the science of our world.
Esri has a whole website that’s dedicated to GIS Day – I found this storymap particularly interesting and definitely worth sharing. Also, don’t miss the Library of Congress’s GIS Day on November 18th - Mapping the Pandemic.
Additionally, I personally found these maps worth a view:
Esri Covid Pulse for some scary truth
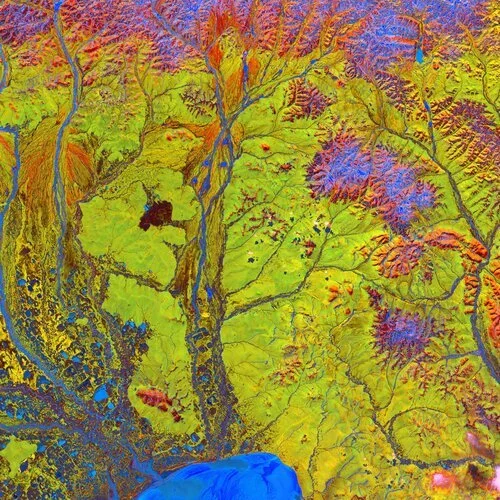
In the Shadow of a Volcano – Nice to see from a distance!
Salmon River’s South Fork – I want to visit this place!

INFRAMARKER RFID DRIVES TVC COMPLIANCE
Berntsen International, the leader in infrastructure marking solutions, announced that it has partnered with CHA Integrated Solutions (formerly NovaraGeo Solutions) to provide it’s InfraMarker RFID capability within the Corrivo mobile software platform, delivering Traceable, Verifiable and Complete (TVC) field asset data.
InfraMarker RFID Drives TVC Compliance in CHA Integrated Solutions’ Newest Asset Management Solution, Corrivo
Berntsen International, the leader in infrastructure marking solutions, announced that it has partnered with CHA Integrated Solutions (formerly NovaraGeo Solutions) to provide it’s InfraMarker RFID capability within the Corrivo mobile software platform, delivering Traceable, Verifiable and Complete (TVC) field asset data.
See it at the ESRI Infrastructure Management & GIS Conference on Cot. 29, 2020
CHA Integrated Solutions will highlight its Corrivo Solution at Esri’s upcoming Infrastructure Management & GIS Conference.
Title: Field Auditable Compliance for Utilities: Execute all of your compliance activities in one solution
How to leverage a mobile solution with integrated sensors to provide TVC data for field inspections, leak surveys and more.
Presenter: Neal O’Driscoll, Integrated Solutions Business Line Director for CHA Integrated Solutions
Date/Time: Thursday, October 29 at 10:15 am - 11:15 am Pacific
CHA Integrated Solutions' Corrivo technology platform provides a full loop (office-to-field-to-office) process management that helps pipeline operators and utilities in the planning, execution, documentation, management and reporting of inspection, compliance, integrity, repair, O&M, and other in-the-field activities. The new InfraMarker® RFID component delivers TVC capability in the field by verifying asset identity and automatically documenting the date, time and location each specific asset was accessed. This verified data enhances Corrivo’s ability to manage field operations and captures the regulatory information operators need for regulatory compliance.
As an Esri Gold Partner, CHA Integrated Solutions has been awarded the Esri Release Ready Specialty status. This significant recognition is given to partners that show innovation with Esri technology, are committed to developing their wide-ranging expertise and offer expert technical support for a variety of Esri solutions and products.
“More and more, utilities are seeking ways to leverage their compliance activity to better manage their operations. The Corrivo Technology platform makes that possible, by integrating Berntsen’s proven InfraMarker RFID technology to streamline workflows and improve compliance,“ said Mike Klonsinski, president of Berntsen. “By integrating InfraMarker RFID, the Corrivo Solution speeds asset locating while providing field-auditable data.”
About Berntsen International, Inc. and its InfraMarker solution:
As an infrastructure marking company, Berntsen has been developing smart marking products for more than a decade. Its patented InfraMarker RFID solution combines the durability and precision of all Berntsen marking products with a unique application of RFID technology specifically developed to connect physical markers with digital records. Berntsen has been an Esri Silver Partner for more than a decade.
Benefits of RFID marking of infrastructure assets:
Easy to use – Simple install, set up and applicaiton
Works with any asset – Above or below ground, InfraMarker passive RFID tags are designed for all types of asset marking
Enhances existing workflows – Makes GIS indispensable to field crews.
Contact Berntsen/InfraMarker to learn more about how InfraMarker RFID can streamline workflows and improve compliance in your operation.
Berntsen.com
InfraMarker is a registered trademark of Berntsen International, Inc.
About CHA integrated solutions
CHA Integrated Solutions offers a wide range of asset management, GIS consulting and mapping services, including GPS field data collection, spatial analysis, geospatial database design and implementation, data loading and validation, web-based GIS application development, PODS data migrations, regulatory compliance solutions and more. For more information or to set up a demo, please visit CHA-IS.chacompanies.com.
CONTACT: Debra Oakes, Public Relations, Berntsen International, Inc.
Phone: 608.443.2773
Email: doakes@berntsen.com

INVESTMENTS IN SUBSURFACE UTILITY MAPPING TECHNOLOGY MEAN BIG SAVINGS FOR CITIES
Construction intended to improve public infrastructure is the most costly and involved public works undertakings by government and contracting firms.
It’s surprising that many of the costs associated with large-scale construction projects stem from either relocating underground utilities or simply designing around them so they don’t need to be moved.
These costs could be avoided if accurate information about the nature and location of underground utilities were available. Unfortunately, accurate data is not available. In many cases missing or inaccurate buried infrastructure information increases the risk of cost and schedule overruns – compounding the expense of major projects.
This lack of buried asset information is estimated to cost the U.S. about $50 billion annually. Traditional mapping and marking techniques simply don’t provide the accuracy required for large scale construction projects.
THIS LACK OF BURIED ASSET INFORMATION IS ESTIMATED TO COST THE U.S. ABOUT $50 BILLION ANNUALLY.
Traditional mapping and marking techniques simply don’t provide the accuracy required for large scale construction projects.

THIS LACK OF BURIED ASSET INFORMATION IS ESTIMATED TO COST THE U.S. ABOUT $50 BILLION ANNUALLY.
Studies show that better mapping systems translate to significant savings
According to a 1999 Purdue University survey sponsored by the US Department of Transportation, a total of $4.62 was saved for every $1.00 spent when comprehensive underground utility location maps informed construction projects.
A 2004 study by the Ontario Sewer and Water main Contractors Association and the University of Toronto found that the average rate of return on every dollar spent to improve the visibility of subsurface utilities resulted in a savings of $3.41.
In 2010 study by the University of Toronto monitored nice large city and highway rebuilding projects found that accurate underground utility marking benefitted every project. Further, a positive ROI on $2.05 to $6.59 resulted from every dollar spent to improve underground utility mapping.
RFID is a cost-saving alternative
Today, many public works departments utilize GIS that can display the location of underground utilities. However, even with GIS-based asset management systems, precision may be difficult to come by. Most systems rely on GPS to find locations, which is only accurate within several feet – not good enough when locating underground gas lines, for instance.
The best way to accurately find underground assets is to physically mark them – then find those markers before construction begins. Fortunately, a combination of proven, reliable technology is now available to streamline this process.
The InfraMarker® RFID-enabled asset management system leverages the unique marking ability of RFID connected to a mobile app that can quickly append data to each specific RFID marker. This data is connected to the GIS and provides a detailed, accurate map of each underground asset – information that can be audited, updated and tracked in the GIS.
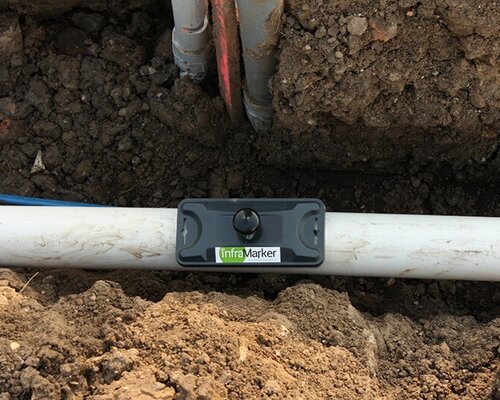
Each RFID-enabled marker is rugged, unique and passive which means that it can last as long as the infrastructure and will continue to provide specific asset information each time it is read.
This system provides the accuracy, location verification and comprehensive data that utilities can rely on for accurately mapping and managing both subsurface and above-ground infrastructure assets.
Just contact us to set up a demo to see how the simple, easy-to-use and setup InfraMarker system can save time, money and provide the data you need with the accuracy you require.

THE CRUCIAL FIRST STEP IN FIXING AMERICA'S AGING UNDERGROUND UTILITY INFRASTRUCTURE
Over the next 20 years, upgrades to the nation’s water system alone are expected to cost three to five trillion dollars. Yet appropriations to replace critical infrastructure continually fall short. Municipalities and utility companies are under enormous pressure to make existing assets more efficient.

Projected growth
By 2050, the US population is projected to grow by 30 percent.
That’s an additional 100 million people putting stress and strain on a already overworked public infrastructure made up of roads, bridges, tunnels and a myriad of other vital systems.
Over the next 20 years, upgrades to the nation’s water system alone are expected to cost three to five trillion dollars. Yet appropriations to replace critical infrastructure continually fall short. Municipalities and utility companies are under enormous pressure to make existing assets more efficient.
Fixing this problem will not be cheap or easy.
While crumbling roadways, cracked bridges and deteriorating railways grab national attention, the country’s vast, hidden infrastructure suffers from the same level of neglect and under-investment. Specifically, the system that carries our drinking water, sewage and stormwater is critically neglected.
The question is, how can utilities and municipalities best manage existing assets?
The answer is:
Develop a complete inventory of assets
Monitor assets for problems and investigate causes
Assess the life-cycle of materials and the cost of their procurement and replacement
Rehabilitate underground asset networks
Prioritize the selection, design and timing of replacing aging assets.
RFID and the future of underground asset management
Part of what makes the problems of aging underground infrastructure so difficult is the lack of even basic data on asset type, location and condition. Radio Frequency Identification (RFID) is proving to be a valuable tool that links physical locations of assets with a GIS system. This means that asset manager get accurate, verified information about each physical asset through commonly used asset management systems that leverage GIS, such as Cityworks.
Updating a record in the InfraMarker mobile app.
Updating a record in the InfraMarker mobile app.
This information is used to efficiently manage inspection and repair activities. How does it work? RFID tags are affixed to an asset, that tag is accessed using a simple mobile app that stores its location and unique identifier. Any amount of information can be added to that record, such as inspection logs and so forth. This data is then available to the GIS where it can be accessed by managers or any field personnel who need it.
For example, catch basins require inspection on a regular basis; oftentimes an area of a few hundred square feet can have dozens of catch basins. Crews often waste a large amount of time trying to figure out which basin they are inspecting vs what they are scheduled to inspect. The GIS and GPS can direct workers to the general area but lack the precision to verify location. However, when an asset is tagged with an InfraMarker RFID tag, field workers can simply scan the tag, and access its record in a mobile app. No guesswork is involved, and an auditable track is automatically generated, meeting regulatory requirements.
Want to learn more? Arrange a demo today!
RFID Expedites Recovery
Disasters run the gamut, from environmental factors to cyber-threats to aging infrastructure. Keep in mind America receives an overall grade of D+ on the American Society of Civil Engineers Infrastructure Report Card, with the categories of drinking water, energy, and wastewater receiving a D or D+ mark.
Disasters Underscore Critical Need for Connected Utility Infrastructure
Digital Mapping Expedites Disaster Recovery, Has the Potential to Save Lives
On Sept. 14, 2018, Hurricane Florence slammed into the Carolinas, bringing with her powerful winds, torrential rains and the potential to wreak catastrophic destruction. Though Florence was downgraded to a Category 1 storm as it moved over land, its high winds and rain toppled trees, triggered massive flooding and caused power transformers to explode like fireworks, leaving hundreds of thousands of people without power. More than 40 people have died as a result of the storm and flooding.
A day earlier, 800 miles up the East Coast, another disaster had occurred. Dozens of rapid-fire gas explosions caused 70 home fires and one fatality in what one official described as “Armageddon.” Entire neighborhoods north of Boston were forced to evacuate, and firefighters and crews scrambled to fight the flames and shut off the gas and electricity to the affected areas. The fires were caused when too much natural gas was pumped into a section of pipe and then leaked into homes.

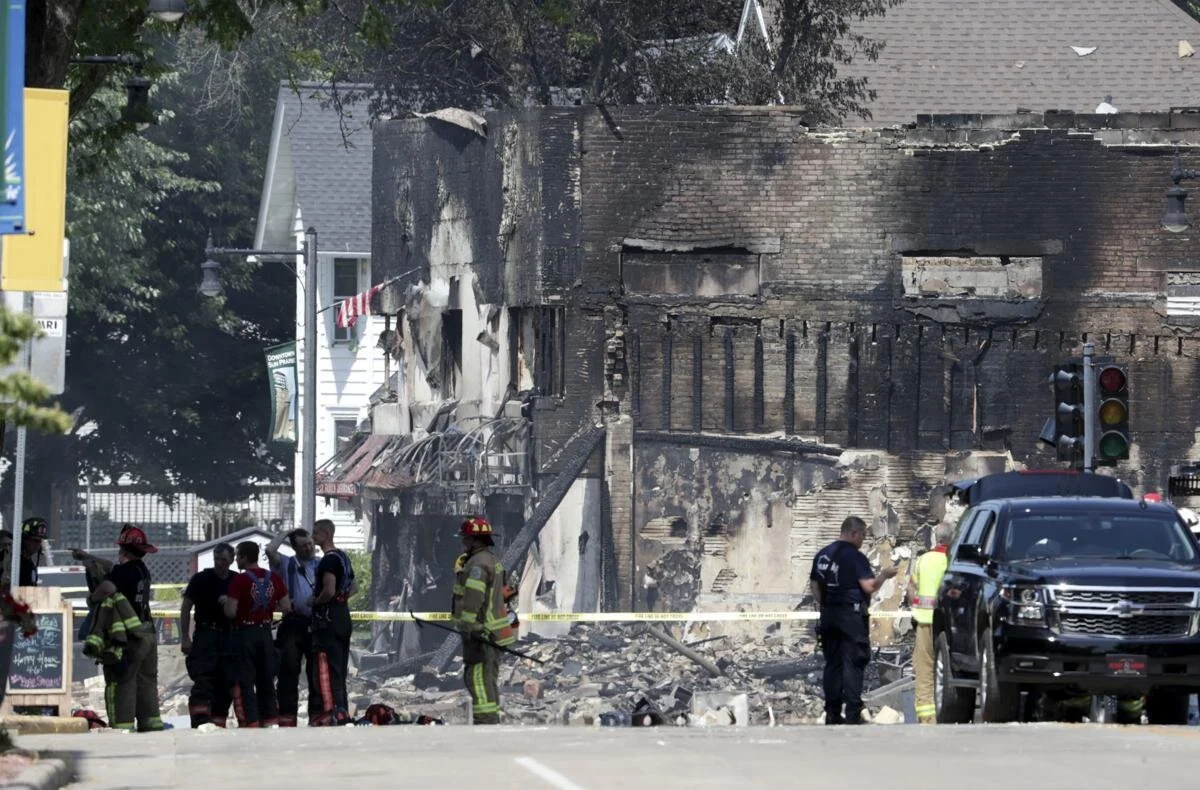
These disasters—and others including the California wildfires and Hurricanes Harvey and Irma—are a cogent reminder of the critical need to upgrade and digitize our utility infrastructure. This is especially relevant for all of us at Berntsen who live and work in Wisconsin, where a massive explosion destroyed a city block in downtown Sun Prairie and killed a volunteer firefighter in July. The fact that we design equipment that might have prevented this disaster and so many others saddens us, and this tragedy has deeply affected our employees.
Disasters on the Rise

Disasters run the gamut, from environmental factors to cyber-threats to aging infrastructure. Keep in mind America receives an overall grade of D+ on the American Society of Civil Engineers Infrastructure Report Card, with the categories of drinking water, energy, and wastewater receiving a D or D+ mark.
A 2017 report prepared by Johns Hopkins University notes that the U.S. insurance industry has identified a $20 to $55 billion annual financial loss from power outages caused by flooding, hurricanes, and extreme temperatures. A combination of “higher average global temperatures, more destructive storms, and hurricanes, and increased risk of wildfire will ultimately worsen risk exposure for utilities,” the report states.
Many public and private utilities have state-of-the-art asset management systems to tackle the challenge of disasters, but the widespread deployment of these systems is lacking in much of the country, putting communities and citizens at greater risk. Over time, failure to adopt digital technologies will lead to slower disaster recovery times, potentially greater loss of life and bigger financial losses to business and the public.
“Over time, failure to adopt digital technologies will lead to slower disaster recovery times, potentially greater loss of life and bigger financial losses to business and the public. ”
The good news is digital transformation is coming to the utility industry and innovative technologies already exist to improve disaster planning, response, recovery, and underground asset management.
Connected Marking and Digital Mapping Are a Game Changer

Disasters such as storms, wildfires, explosions, and earthquakes often require gas, water, electric and telecommunications companies to quickly identify, locate and access underground utility assets.
In August 2017, a major fiber network outage in Atlantic Canada shut down cellphone and Internet service, closed some bank branches and delayed flights at multiple airports. The problem was caused when two fiber optics lines were cut during construction work.
The ability to quickly locate and repair underground utility assets is often hampered by outdated maps and inaccurate data. During a disaster, these delays can be devastating and deadly.
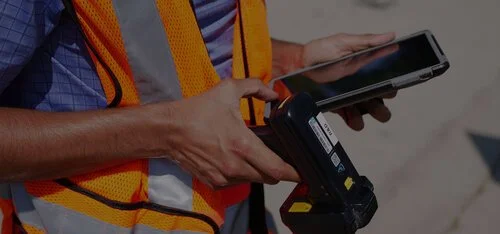
Connected marking solutions for utility infrastructure such as the InfraMarker® system from Berntsen International are a game changer for asset management and extremely helpful in disaster recovery. In a disaster, utility crews can use the InfraMarker mobile app and digital mapping software to quickly find the exact location of a gas pipeline shut-off valve to prevent an explosion. It’s that powerful.
This unique combination of RFID, mobile app and digital mapping software significantly expedites underground utility locating.
InfraMarker is a secure and easy way to collect and relay essential utility asset data. From there, the data can be accessed on smartphones and by popular GIS systems such as ArcGIS. Going forward, connected marking solutions will play an integral role in Smart City utility asset management.

In the past, the most important part of infrastructure management was to locate the asset. Today, infrastructure management requirements are greater and more complex. Location and other relevant data need to be available to multiple users faster—ideally in real-time—and to be integrated with GIS, ERP, workflow management and regulatory/compliance systems.
RFID is a highly effective tool for precision locating. But the key advantage of connected marking is the ability to collect, store and share asset data via the cloud. This next-gen innovation delivers exceptional benefits and ROI to utility asset managers, emergency responders, and citizens, and also has the potential to save lives.

RFID Expedities Recovery
Disasters run the gamut, from environmental factors to cyber-threats to aging infrastructure. Keep in mind America receives an overall grade of D+ on the American Society of Civil Engineers Infrastructure Report Card, with the categories of drinking water, energy, and wastewater receiving a D or D+ mark.
Disasters underscore critical need for connected utility infrastructure
Digital mapping expedites disaster recovery, has the potential to save lives
On Sept. 14, 2018, Hurricane Florence slammed into the Carolinas, bringing with her powerful winds, torrential rains and the potential to wreak catastrophic destruction. Though Florence was downgraded to a Category 1 storm as it moved over land, its high winds and rain toppled trees, triggered massive flooding and caused power transformers to explode like fireworks, leaving hundreds of thousands of people without power. More than 40 people have died as a result of the storm and flooding.
A day earlier, 800 miles up the East Coast, another disaster had occurred. Dozens of rapid-fire gas explosions caused 70 home fires and one fatality in what one official described as “Armageddon.” Entire neighborhoods north of Boston were forced to evacuate, and firefighters and crews scrambled to fight the flames and shut off the gas and electricity to the affected areas. The fires were caused when too much natural gas was pumped into a section of pipe and then leaked into homes.
These disasters—and others including the California wildfires and Hurricanes Harvey and Irma—are a cogent reminder of the critical need to upgrade and digitize our utility infrastructure. This is especially relevant for all of us at Berntsen who live and work in Wisconsin, where a massive explosion destroyed a city block in downtown Sun Prairie and killed a volunteer firefighter in July. The fact that we design equipment that might have prevented this disaster and so many others saddens us, and this tragedy has deeply affected our employees.
Disasters on the rise
Disasters run the gamut, from environmental factors to cyber-threats to aging infrastructure. Keep in mind America receives an overall grade of D+ on the American Society of Civil Engineers Infrastructure Report Card, with the categories of drinking water, energy, and wastewater receiving a D or D+ mark.
A 2017 report prepared by Johns Hopkins University notes that the U.S. insurance industry has identified a $20 to $55 billion annual financial loss from power outages caused by flooding, hurricanes, and extreme temperatures. A combination of “higher average global temperatures, more destructive storms, and hurricanes, and increased risk of wildfire will ultimately worsen risk exposure for utilities,” the report states.
Many public and private utilities have state-of-the-art asset management systems to tackle the challenge of disasters, but the widespread deployment of these systems is lacking in much of the country, putting communities and citizens at greater risk. Over time, failure to adopt digital technologies will lead to slower disaster recovery times, potentially greater loss of life and bigger financial losses to business and the public.
The good news is digital transformation is coming to the utility industry and innovative technologies already exist to improve disaster planning, response, recovery, and underground asset management.
Connected marking and digital mapping are a game changer
Disasters such as storms, wildfires, explosions, and earthquakes often require gas, water, electric and telecommunications companies to quickly identify, locate and access underground utility assets.
In August 2017, a major fiber network outage in Atlantic Canada shut down cellphone and Internet service, closed some bank branches and delayed flights at multiple airports. The problem was caused when two fiber optics lines were cut during construction work.
The ability to quickly locate and repair underground utility assets is often hampered by outdated maps and inaccurate data. During a disaster, these delays can be devastating and deadly.
Connected marking solutions for utility infrastructure such as the InfraMarker® system from Berntsen International are a game changer for asset management and extremely helpful in disaster recovery. In a disaster, utility crews can use the InfraMarker mobile app and digital mapping software to quickly find the exact location of a gas pipeline shut-off valve to prevent an explosion. It’s that powerful.
This unique combination of RFID, mobile app and digital mapping software significantly expedites underground utility locating.
InfraMarker is a secure and easy way to collect and relay essential utility asset data. From there, the data can be accessed on smartphones and by popular GIS systems such as ArcGIS. Going forward, connected marking solutions will play an integral role in Smart City utility asset management.
In the past, the most important part of infrastructure management was to locate the asset. Today, infrastructure management requirements are greater and more complex. Location and other relevant data need to be available to multiple users faster—ideally in real-time—and to be integrated with GIS, ERP, workflow management and regulatory/compliance systems.
RFID is a highly effective tool for precision locating. But the key advantage of connected marking is the ability to collect, store and share asset data via the cloud. This next-gen innovation delivers exceptional benefits and ROI to utility asset managers, emergency responders, and citizens, and also has the potential to save lives.

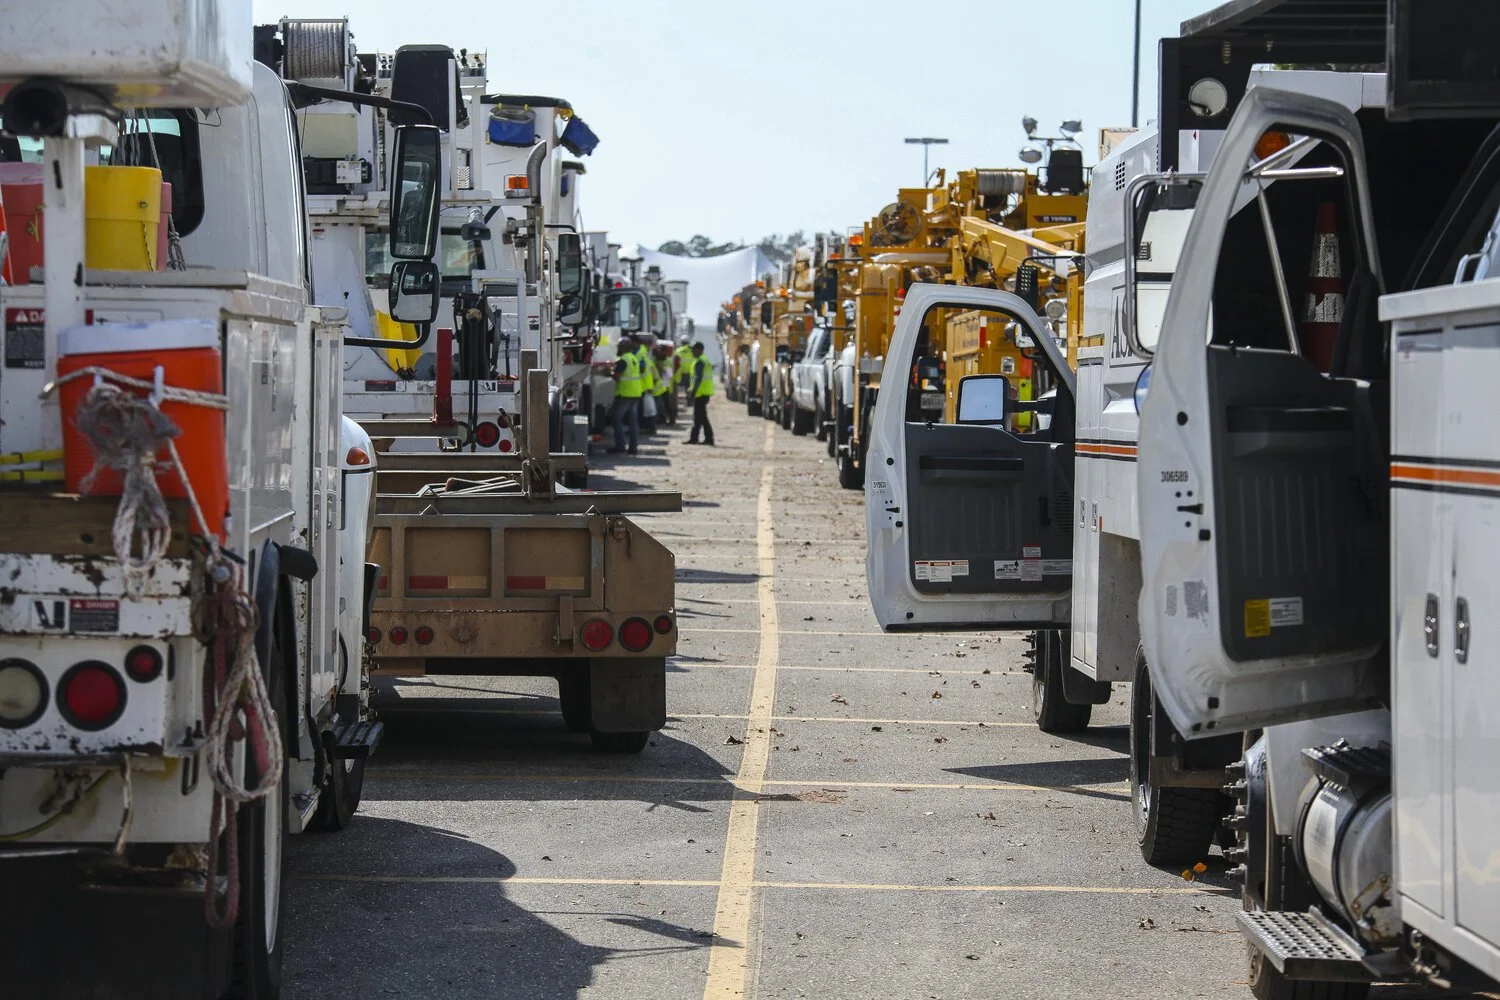
Image credit: FEMA - Utility Trucks and Crews Line up To Help

Image credit: Wisconsin State Journal
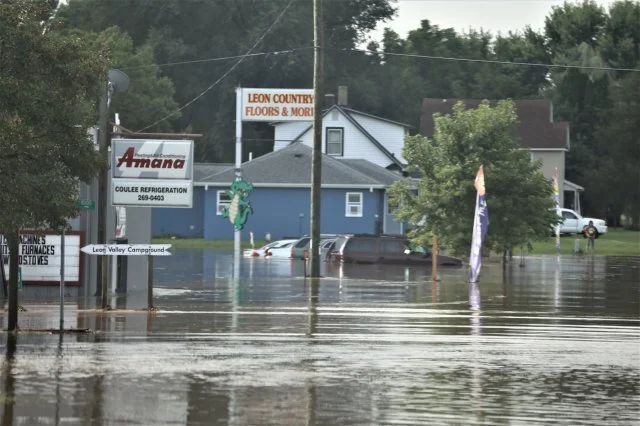
Image credit: US Army
Over time, failure to adopt digital technologies will lead to slower disaster recovery times, potentially greater loss of life and bigger financial losses to business and the public.